Garbage Collection Tuning
We faced connection issue between database, a routing server, a gateway server and a external side server. The applications architecture is defined as following:
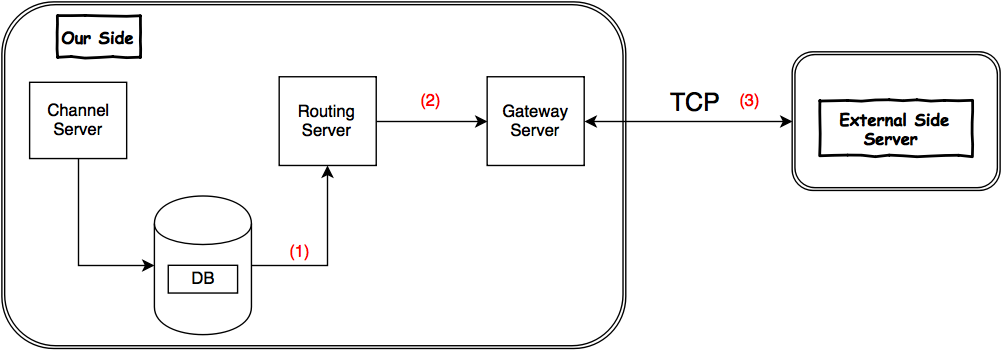
From the diagram, we can tell that the connection issue would possibly happen in position (1), (2) and (3) but we cannot exactly distinguish where the disconnection problems occur without further information. To locate the issue, we are going to reproduce the case by doing some load tests in the UAT environment.
To simulate the case, we made a loading client which periodically submit bulk orders to channel server. As scheduled, channel server will receive those bulk orders and insert the records into database. The routing server periodically retrieves the pending records created by the channel server and routs them to gateway server and send them to external side server for validation.
After several trials, connection issue was reproduced observed from the log information, which tells “Disconnecting Socket” in the gateway server log. Having observed from the logs, we saw that there are no problems for routing server to retrieve records from database thus excluding the possibility that issue happened in (1). Also, external side verify that no messages received since the connection issue occurs. That said, something went wrong in (2) before the gateway interact between the external side.
Now that, we’ve investigated that some mysteries happened in between routing server and gateway server. One strange thing observed from the log is that to many time out logs are printed. As the routing server is working under HA mode therefore, the primary (mater) one will periodically kick the secondary. However, time out error occurred several time in just 1 second(See the following log information).
2016-04-13 15:12:19,454  INFO NodeMonitor_Secondary Secondary:? - Disconnecting socket: Socket[addr=/172.25.19.223,port=6905,localport=57727] Secondary: Failed to return stats in time
2016-04-13 15:12:27,611  INFO NodeMonitor_Secondary Secondary:? - Disconnecting socket: Socket[addr=/172.25.19.223,port=6905,localport=57751] Secondary: Failed to return stats in time
2016-04-13 15:12:36,044  INFO NodeMonitor_Secondary Secondary:? - Disconnecting socket: Socket[addr=/172.25.19.223,port=6905,localport=57772] Secondary: Failed to return stats in time
2016-04-13 15:12:44,179  INFO NodeMonitor_Secondary Secondary:? - Disconnecting socket: Socket[addr=/172.25.19.223,port=6905,localport=57798] Secondary: Failed to return stats in time
2016-04-13 15:12:52,368  INFO NodeMonitor_Secondary Secondary:? - Disconnecting socket: Socket[addr=/172.25.19.223,port=6905,localport=57816] Secondary: Failed to return stats in time
From this symptom, it’s susceptible that JVM is not in a normal status as there should be NO network connection between these two server as they resided in the same sub-network i.e. no firewall or delay problems should be raised between their communications.
- Is GC tuning required ? If you have not set the memory size and too many Timeout logs are printed, you need to perform GC tuning on your system.
As checked, there is no configuration for memory size setting for the gateway server. Therefore, it is very likely that the connection issue was caused by JVM. To verify this, we need to make some JVM tuning. Before go thru it, let’s take a look at the basic knwoledge of JVM tuning.
Table 1 JVM Option to Be Checked for GC Tunning
| Classification | Option | Description |
|---|---|---|
| Heap area size | -Xms | Heap area size when staring JVM |
| -Xmx | Maximum heap area size |
By setting the -Xms and -Xmx size, we are telling how much space JVM could use from the memory. But think about the fundamental cause of GC tuning. The garbage collector clears an object created in JAVA. The number of objects necessary to be cleared by the garbage collector as well as the number of GCs to be executed depend on the number of objects which have been created. So by increasing the memory size for JVM, more created object may be stored in heap thus reduce the frequency of garbage collection however burdening the garbage collector to clear the objects as more “garbages” are created.
Before making any GC tuning, we should first monitor GC status of the application.
- Monitoring GC status
There are many ways and tools for Java developer to monitor the GC status. In our test, since we have the routing server and gateway server running for a whole day. Therefore, we decide to enable verbose gc option. This is a important feature provided by the Hopspot JVM. To turn the GC on, you need to configure the startup script with something like following:
-J-verbose:gc -XX:+PrintGCDetails -XX:+PrintGCDateStamps -Xloggc:.\log\gclog.txt
- -XX:+PrintGCDetails - Print a long message with more details after each garbage collection is done.
- -XX:+PrintGCDateStamps - Print a calendar data and timestamp when a garbage collection occurs.
- -Xloggc: Force garbage collection message to be logged into a file instead of the console.
With turning on the GC option, we have the following GC logs (partial) .
1.252: [GC 1.252: [DefNew: 2176K->256K(2432K), 0.0042701 secs] 2176K->572K(7936K), 0.0043260 secs] [Times: user=0.00 sys=0.00, real=0.00 secs]
1.743: [GC 1.743: [DefNew: 2432K->179K(2432K), 0.0040748 secs] 2748K->749K(7936K), 0.0041287 secs] [Times: user=0.02 sys=0.00, real=0.02 secs]
1.884: [GC 1.884: [DefNew: 2355K->80K(2432K), 0.0027305 secs] 2925K->821K(7936K), 0.0027730 secs] [Times: user=0.00 sys=0.00, real=0.00 secs]
1.984: [GC 1.984: [DefNew: 2227K->227K(2432K), 0.0027990 secs] 2967K->968K(7936K), 0.0028518 secs] [Times: user=0.00 sys=0.00, real=0.00 secs]
2.054: [Full GC (System) 2.054: [Tenured: 740K->940K(5504K), 0.0176106 secs] 2039K->940K(7936K), [Perm : 6983K->6983K(12288K)], 0.0176905 secs] [Times: user=0.01 sys=0.00, real=0.02 secs]
2.222: [GC 2.222: [DefNew: 2304K->201K(2560K), 0.0027992 secs] 3244K->1141K(8064K), 0.0028462 secs] [Times: user=0.00 sys=0.00, real=0.00 secs]
2.274: [GC 2.274: [DefNew: 2505K->255K(2560K), 0.0039748 secs] 3445K->2311K(8064K), 0.0040195 secs] [Times: user=0.00 sys=0.00, real=0.00 secs]
2.292: [GC 2.292: [DefNew: 2559K->255K(2560K), 0.0048878 secs] 4615K->3599K(8064K), 0.0049322 secs] [Times: user=0.02 sys=0.00, real=0.02 secs]
2.309: [GC 2.309: [DefNew: 2557K->256K(2560K), 0.0051817 secs] 5901K->4940K(8064K), 0.0052289 secs] [Times: user=0.01 sys=0.00, real=0.02 secs]
2.346: [GC 2.346: [DefNew: 2560K->256K(2560K), 0.0049350 secs]2.351: [Tenured: 5918K->6015K(6016K), 0.0288489 secs] 7244K->6174K(8576K), [Perm : 7431K->7431K(12288K)], 0.0339124 secs] [Times: user=0.03 sys=0.00, real=0.03 secs]
2.388: [GC 2.388: [DefNew: 4160K->447K(4608K), 0.0172625 secs] 10175K->8879K(14636K), 0.0173176 secs] [Times: user=0.02 sys=0.00, real=0.02 secs]
2.419: [GC 2.419: [DefNew: 4607K->448K(4608K), 0.0146778 secs]2.434: [Tenured: 11087K->11179K(11180K), 0.0575710 secs] 13039K->11535K(15788K), [Perm : 7440K->7440K(12288K)], 0.0724600 secs] [Times: user=0.08 sys=0.00, real=0.08 secs]
2.544: [GC 2.544: [DefNew: 7616K->895K(8512K), 0.0207230 secs] 18795K->12307K(27148K), 0.0208716 secs] [Times: user=0.03 sys=0.00, real=0.03 secs]
2.604: [GC 2.604: [DefNew: 8511K->464K(8512K), 0.0071858 secs] 19923K->12739K(27148K), 0.0072582 secs] [Times: user=0.01 sys=0.00, real=0.02 secs]
2.645: [GC 2.645: [DefNew: 8080K->186K(8512K), 0.0025685 secs] 20355K->12921K(27148K), 0.0026126 secs] [Times: user=0.00 sys=0.00, real=0.00 secs]
2.709: [GC 2.709: [DefNew: 7802K->896K(8512K), 0.0042802 secs] 20537K->13901K(27148K), 0.0043268 secs] [Times: user=0.00 sys=0.00, real=0.00 secs]
2.806: [GC 2.806: [DefNew: 8512K->896K(8512K), 0.0159059 secs] 21517K->17551K(27148K), 0.0159693 secs] [Times: user=0.02 sys=0.00, real=0.02 secs]
2.841: [GC 2.841: [DefNew: 8512K->896K(8512K), 0.0201802 secs]2.861: [Tenured: 21571K->11082K(21580K), 0.0566198 secs] 25167K->11082K(30092K), [Perm : 7739K->7698K(12288K)], 0.0771059 secs] [Times: user=0.08 sys=0.00, real=0.09 secs]
2.939: [GC 2.939: [DefNew: 7616K->895K(8512K), 0.0079424 secs] 18698K->13680K(27148K), 0.0079954 secs] [Times: user=0.00 sys=0.00, real=0.01 secs]
2.974: [GC 2.974: [DefNew: 8511K->742K(8512K), 0.0046285 secs] 21296K->14395K(27148K), 0.0047012 secs] [Times: user=0.00 sys=0.00, real=0.01 secs]
3.014: [GC 3.014: [DefNew: 8358K->128K(8512K), 0.0028490 secs] 22011K->14523K(27148K), 0.0028945 secs] [Times: user=0.00 sys=0.00, real=0.00 secs]
3.049: [GC 3.049: [DefNew: 7744K->354K(8512K), 0.0020036 secs] 22139K->14748K(27148K), 0.0020508 secs] [Times: user=0.00 sys=0.00, real=0.00 secs]
4.755: [GC 4.755: [DefNew: 7970K->727K(8512K), 0.0039309 secs] 22364K->15121K(27148K), 0.0039790 secs] [Times: user=0.00 sys=0.00, real=0.00 secs]
5.042: [GC 5.042: [DefNew: 8343K->674K(8512K), 0.0056314 secs] 22737K->15419K(27148K), 0.0056960 secs] [Times: user=0.01 sys=0.00, real=0.01 secs]
5.271: [GC 5.271: [DefNew: 8290K->815K(8512K), 0.0064734 secs] 23035K->15904K(27148K), 0.0065254 secs] [Times: user=0.00 sys=0.00, real=0.01 secs]
5.441: [GC 5.441: [DefNew: 8431K->221K(8512K), 0.0050523 secs] 23520K->16103K(27148K), 0.0051174 secs] [Times: user=0.00 sys=0.00, real=0.00 secs]
5.604: [GC 5.604: [DefNew: 7837K->456K(8512K), 0.0030621 secs] 23719K->16339K(27148K), 0.0031186 secs] [Times: user=0.00 sys=0.00, real=0.00 secs]
5.940: [GC 5.940: [DefNew: 8072K->411K(8512K), 0.0042452 secs] 23955K->16443K(27148K), 0.0043131 secs] [Times: user=0.00 sys=0.00, real=0.00 secs]
6.596: [GC 6.596: [DefNew: 8027K->787K(8512K), 0.0036859 secs] 24059K->16819K(27148K), 0.0037348 secs] [Times: user=0.00 sys=0.00, real=0.00 secs]
6.675: [GC 6.675: [DefNew: 8403K->546K(8512K), 0.0047118 secs] 24435K->16975K(27148K), 0.0047805 secs] [Times: user=0.00 sys=0.00, real=0.00 secs]
6.747: [GC 6.747: [DefNew: 8162K->423K(8512K), 0.0031862 secs] 24591K->17213K(27148K), 0.0032334 secs] [Times: user=0.03 sys=0.00, real=0.02 secs]
6.822: [GC 6.822: [DefNew: 8039K->453K(8512K), 0.0020139 secs] 24829K->17243K(27148K), 0.0020600 secs] [Times: user=0.00 sys=0.00, real=0.00 secs]
6.892: [GC 6.893: [DefNew: 8069K->594K(8512K), 0.0027436 secs] 24859K->17526K(27148K), 0.0027906 secs] [Times: user=0.00 sys=0.00, real=0.00 secs]
7.549: [Full GC 7.549: [Tenured: 16931K->6193K(18636K), 0.0620230 secs] 18940K->6193K(27148K), [Perm : 16383K->16383K(16384K)], 0.0621020 secs] [Times: user=0.06 sys=0.00, real=0.06 secs]
7.976: [GC 7.976: [DefNew: 7616K->296K(8512K), 0.0034289 secs] 13809K->6490K(27148K), 0.0034773 secs] [Times: user=0.00 sys=0.00, real=0.00 secs]
8.168: [GC 8.168: [DefNew: 7912K->896K(8512K), 0.0042737 secs] 14106K->7174K(27148K), 0.0043257 secs] [Times: user=0.01 sys=0.00, real=0.00 secs]
8.303: [GC 8.303: [DefNew: 8512K->326K(8512K), 0.0048244 secs] 14790K->7486K(27148K), 0.0048758 secs] [Times: user=0.00 sys=0.00, real=0.01 secs]
8.384: [Full GC 8.384: [Tenured: 7159K->7420K(18636K), 0.0671692 secs] 11772K->7420K(27148K), [Perm : 20480K->20480K(20480K)], 0.0672437 secs] [Times: user=0.08 sys=0.00, real=0.07 secs]
As you may observer from above, we could conclude that minor GC is frequently executed in every 1 second which is a unhealthy symptom. JVM is stopping the application from running to execute a GC, which is known as “Stop-the-world(STW)” event. When STW occurs, every threads except for the threads needed for the GC will stop their tasks. Think about our application architecture, we may have large volume of orders to be routed from routing server to gateway server, while large volumes transferring to the gateway, huge amount of objects may be created during the time routing server is submitting orders to our gateway. It seems to be that JVM is frequently clearing the objects for gateway server to proceed which may causing network disconnection while the STW block the application. Now that, we almost locate and find out the problems.
- How to tunning the GC?
As mentioned, we did not configure the heap size for JVM so that JVM will run with the initial heap size and maximum heap size.
Initial heap size: Larger of 1/64th of the machine’s physical memory on the machine or some reasonable minimum. Before J2SE 5.0, the default initial heap size was a reasonable minimum, which varies by platform. You can override this default using the -Xms command-line option.
Maximum heap size: Smaller of 1/4th of the physical memory or 1GB. Before J2SE 5.0, the default maximum heap size was 64MB. You can override this default using the -Xmx command-line option.
To set the memory size, we should have a clear mind on the relationship between the memory size, the number of GC execution, and the GC execution time.
- Large memory size
- decreases the number of GC executions.
- increases the GC execution time.
- Small memory size
- decreases the GC execution time.
- increases the number of GC executions.
Our trail is to decrease the number of GC executions so that reducing the STW event which possibly causing the network disconnection. So, we try to set the initial and maximum heap size to 1024m. Again, we do the load test and log the information for further investigation.
As expected, we successfully reduce the GC frequency and solving the connection issue. Below is the GC log (partial) after tunning.
2016-03-30T12:39:35.362+0800: 150.254: [GC 150.254: [DefNew: 279616K->8913K(314560K), 0.0271920 secs] 288597K->17894K(1013632K), 0.0273281 secs] [Times: user=0.02 sys=0.00, real=0.02 secs]
2016-03-30T12:40:05.706+0800: 180.601: [GC 180.601: [DefNew: 288529K->9180K(314560K), 0.0217206 secs] 297510K->18162K(1013632K), 0.0218153 secs] [Times: user=0.01 sys=0.00, real=0.02 secs]
2016-03-30T12:40:36.815+0800: 211.709: [GC 211.709: [DefNew: 288796K->9015K(314560K), 0.0195346 secs] 297778K->17996K(1013632K), 0.0196559 secs] [Times: user=0.02 sys=0.00, real=0.02 secs]
2016-03-30T12:41:08.175+0800: 243.072: [GC 243.072: [DefNew: 288631K->9187K(314560K), 0.0188882 secs] 297612K->18169K(1013632K), 0.0189890 secs] [Times: user=0.02 sys=0.00, real=0.02 secs]
2016-03-30T12:41:39.394+0800: 274.293: [GC 274.294: [DefNew: 288803K->9089K(314560K), 0.0192443 secs] 297785K->18071K(1013632K), 0.0193430 secs] [Times: user=0.01 sys=0.00, real=0.01 secs]
2016-03-30T12:42:10.737+0800: 305.638: [GC 305.638: [DefNew: 288705K->9283K(314560K), 0.0189683 secs] 297687K->18264K(1013632K), 0.0190915 secs] [Times: user=0.01 sys=0.00, real=0.02 secs]
2016-03-30T12:42:42.097+0800: 336.992: [GC 336.992: [DefNew: 288899K->9282K(314560K), 0.0202112 secs] 297880K->18264K(1013632K), 0.0203652 secs] [Times: user=0.01 sys=0.00, real=0.01 secs]
2016-03-30T12:43:13.737+0800: 368.641: [GC 368.641: [DefNew: 288898K->9234K(314560K), 0.0186085 secs] 297880K->18216K(1013632K), 0.0187284 secs] [Times: user=0.03 sys=0.00, real=0.03 secs]
2016-03-30T12:43:41.331+0800: 396.231: [GC 396.231: [DefNew: 288850K->9087K(314560K), 0.0194796 secs] 297832K->18069K(1013632K), 0.0196042 secs] [Times: user=0.01 sys=0.00, real=0.02 secs]
2016-03-30T12:44:13.956+0800: 428.854: [GC 428.854: [DefNew: 288703K->9224K(314560K), 0.0187535 secs] 297685K->18206K(1013632K), 0.0188770 secs] [Times: user=0.02 sys=0.00, real=0.02 secs]
2016-03-30T12:44:44.315+0800: 459.219: [GC 459.219: [DefNew: 288840K->9158K(314560K), 0.0193888 secs] 297822K->18139K(1013632K), 0.0195086 secs] [Times: user=0.03 sys=0.00, real=0.03 secs]
2016-03-30T12:45:16.065+0800: 490.958: [GC 490.959: [DefNew: 288774K->9188K(314560K), 0.0191583 secs] 297755K->18169K(1013632K), 0.0192762 secs] [Times: user=0.01 sys=0.00, real=0.02 secs]
2016-03-30T12:45:47.565+0800: 522.465: [GC 522.465: [DefNew: 288804K->9290K(314560K), 0.0196095 secs] 297785K->18272K(1013632K), 0.0197321 secs] [Times: user=0.02 sys=0.00, real=0.02 secs]
2016-03-30T12:46:19.253+0800: 554.157: [GC 554.157: [DefNew: 288906K->9225K(314560K), 0.0189401 secs] 297888K->18207K(1013632K), 0.0190561 secs] [Times: user=0.03 sys=0.00, real=0.03 secs]
2016-03-30T12:46:50.847+0800: 585.745: [GC 585.745: [DefNew: 288841K->9206K(314560K), 0.0204015 secs] 297823K->18187K(1013632K), 0.0205032 secs] [Times: user=0.01 sys=0.00, real=0.01 secs]
2016-03-30T12:47:19.003+0800: 613.908: [GC 613.908: [DefNew: 288822K->8070K(314560K), 0.0190114 secs] 297803K->17951K(1013632K), 0.0191147 secs] [Times: user=0.03 sys=0.00, real=0.03 secs]
2016-03-30T12:47:50.831+0800: 645.736: [GC 645.736: [DefNew: 287686K->8061K(314560K), 0.0165840 secs] 297567K->17961K(1013632K), 0.0166854 secs] [Times: user=0.03 sys=0.00, real=0.03 secs]
2016-03-30T12:48:22.894+0800: 677.786: [GC 677.786: [DefNew: 287677K->8410K(314560K), 0.0163616 secs] 297577K->18310K(1013632K), 0.0164789 secs] [Times: user=0.02 sys=0.00, real=0.01 secs]
2016-03-30T12:48:52.644+0800: 707.535: [GC 707.535: [DefNew: 288026K->8389K(314560K), 0.0164518 secs] 297926K->18289K(1013632K), 0.0165513 secs] [Times: user=0.01 sys=0.00, real=0.01 secs]
2016-03-30T12:49:23.019+0800: 737.919: [GC 737.919: [DefNew: 288005K->8349K(314560K), 0.0165317 secs] 297905K->18254K(1013632K), 0.0166326 secs] [Times: user=0.02 sys=0.00, real=0.01 secs]
2016-03-30T12:49:55.175+0800: 770.075: [GC 770.075: [DefNew: 287965K->8252K(314560K), 0.0164186 secs] 297870K->18157K(1013632K), 0.0165406 secs] [Times: user=0.01 sys=0.00, real=0.02 secs]
2016-03-30T12:50:27.347+0800: 802.249: [GC 802.249: [DefNew: 287868K->8291K(314560K), 0.0167208 secs] 297773K->18199K(1013632K), 0.0168510 secs] [Times: user=0.01 sys=0.00, real=0.01 secs]
2016-03-30T12:50:57.050+0800: 831.942: [GC 831.942: [DefNew: 287907K->8295K(314560K), 0.0163091 secs] 297815K->18202K(1013632K), 0.0164244 secs] [Times: user=0.02 sys=0.00, real=0.02 secs]
2016-03-30T12:51:27.862+0800: 862.764: [GC 862.764: [DefNew: 287911K->8123K(314560K), 0.0166281 secs] 297818K->18031K(1013632K), 0.0167706 secs] [Times: user=0.02 sys=0.00, real=0.02 secs]
2016-03-30T12:52:00.112+0800: 895.010: [GC 895.010: [DefNew: 287739K->8500K(314560K), 0.0175869 secs] 297647K->18408K(1013632K), 0.0177101 secs] [Times: user=0.02 sys=0.00, real=0.02 secs]
2016-03-30T12:52:32.362+0800: 927.265: [GC 927.265: [DefNew: 288116K->8362K(314560K), 0.0168161 secs] 298024K->18270K(1013632K), 0.0170094 secs] [Times: user=0.01 sys=0.00, real=0.02 secs]
2016-03-30T12:53:00.940+0800: 955.846: [GC 955.846: [DefNew: 287978K->8131K(314560K), 0.0159341 secs] 297886K->18039K(1013632K), 0.0160515 secs] [Times: user=0.01 sys=0.00, real=0.02 secs]
2016-03-30T12:53:33.722+0800: 988.625: [GC 988.625: [DefNew: 287747K->8159K(314560K), 0.0165566 secs] 297655K->18067K(1013632K), 0.0166717 secs] [Times: user=0.01 sys=0.00, real=0.01 secs]
2016-03-30T12:54:06.300+0800: 1021.193: [GC 1021.193: [DefNew: 287775K->8523K(314560K), 0.0172122 secs] 297683K->18431K(1013632K), 0.0173324 secs] [Times: user=0.02 sys=0.00, real=0.02 secs]
2016-03-30T12:54:34.878+0800: 1049.783: [GC 1049.783: [DefNew: 288139K->7963K(314560K), 0.0162951 secs] 298047K->17871K(1013632K), 0.0164222 secs] [Times: user=0.03 sys=0.00, real=0.03 secs]
2016-03-30T12:55:07.659+0800: 1082.551: [GC 1082.551: [DefNew: 287579K->8272K(314560K), 0.0163708 secs] 297487K->18182K(1013632K), 0.0165253 secs] [Times: user=0.02 sys=0.00, real=0.02 secs]
2016-03-30T12:55:40.409+0800: 1115.309: [GC 1115.309: [DefNew: 287888K->8299K(314560K), 0.0173801 secs] 297798K->18210K(1013632K), 0.0174793 secs] [Times: user=0.01 sys=0.00, real=0.02 secs]
2016-03-30T12:56:12.956+0800: 1147.855: [GC 1147.855: [DefNew: 287915K->8511K(314560K), 0.0167915 secs] 297826K->18422K(1013632K), 0.0168977 secs] [Times: user=0.02 sys=0.00, real=0.02 secs]
As observed, minor GC is executed every 30 second compared with 1s previously whose frequency reduced dramatically. Also, no further disconnecting socket time out information was found in the gateway log.
Reference:
http://www.cubrid.org/blog/dev-platform/how-to-tune-java-garbage-collection/